Download as PDF –- CC-BY-NC — 2022-09-18
Part 1: User’s Guide
1.1 Getting Started
Enter Text
If you don’t have any icons on the map on the left pane, create a new one first. Then turn to the upper right to a field called ‘Label’. If the cursor is not blinking there, click the field to move the cursor there so you can start to type. Once you press the Enter key, the new label will also be shown on the map on the left. You may also turn to the right and click the field called ‘Detail’, to make the cursor blinking there and enter text there.

If you’ve got copied text on the clipboard ready for pasting, you can simplify the item creation and filling — see paste.
To enter multiple lines at a single blow, you may use the Insert menu in the menu bar and then click Insert Items. A composition window will open where you can paste, drop or type input. When you’re done with that, press Continue. Your input lines will become new items, and their icons will line up on the map.
You can simplify the input even further if you Launch the Import Wizard from the Insert menu, or just drag and drop text snippets or files directly into the map pane.
Create a New Item
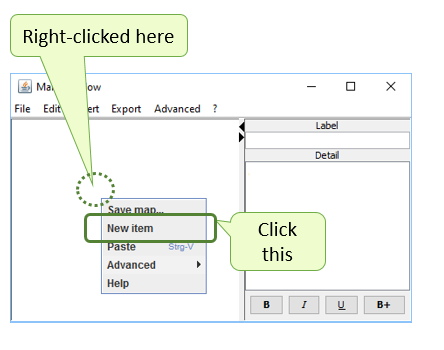
Choose a free spot on the background canvas where no icons or lines are and where the new icon is to be placed. A context menu will pop up. Click New item. Then you may turn to the right and enter some text.
Create a Line
Let’s say you want to draw a line from an icon called ‘Source’ to another icon called ‘Target’. Press and hold the Alt key, then click on the Source icon. Then drag the mouse pointer out of the Source icon while still holding ‘Alt’.
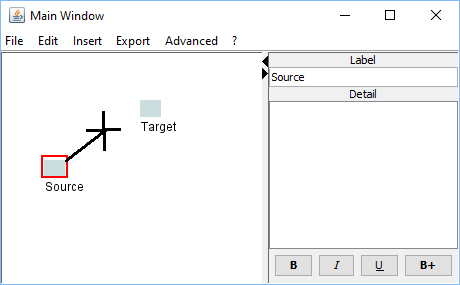
Instead of the Alt key, you may use alternate methods to modify your drag action, see modifier.
Move an Icon
To move a single icon, you click it and drag it, i.e. press and hold the main mouse button while moving the mouse pointer across the map.
All attached ‘strings’ will immediately follow — unlike the strings of the real world, where trying to connect some post-it notes by a string, would be futile.
The main mouse button (or button 1) is typically the one that is operated by the pointer finger of the hand that holds the mouse, i.e., for left-handers it’s the right button, for right-handers it’s the left button. Nevertheless, we will refer to clicking the opposite button (button 2) as ‘right-click’, due to widespread expectations.
If you slightly missed the icon before moving the mouse, one of two unexpected things may happen: either a whole cluster of connected icons is moved (if you hit a line instead of an icon),or the map background canvas is panned (if you hit an empty spot). In either case, nothing is seriously broken, just move back by the approximate same distance.
Delete an Item
Right-click the icon of the item to be deleted, and from the context menu popping up, click Delete. After a confirmation dialog, the item with all its connector lines is deleted.
Delete a Line
Right-click the line to be deleted, and from the context menu popping up, click Delete. After a confirmation dialog, the line is deleted.
Right-click
- on the background canvas: to insert new items and save,
- on an icon: to change its color or delete it,
- on a line: to change its color or delete the line or a whole cluster;
Drag
- the background canvas: to pan the entire map,
- an icon: to move it,
- a line: to move a cluster of connected items
Modified Drag
- press and hold the Alt key: to connect items or drag and drop clusters,
- press and hold the middle mousebutton (wheel): to substitute the Alt key (recommended),
- precede the dragging with a doubleclick: to substitute the Alt key (good for pen).
1.2 Overview
Considering four major benefits of the tool, we’ll cover some of the corresponding user interface elements.
Offloading
Traditional mindmapping or concept mapping tools focus on the input and on the output, while the step in between is largely omitted — because it seems a given that the mental juggling must be entirely done in your head, i.e. the juggling clubs must be always in the air. Our tool, by contrast, helps you to temporarily offload part of the stuff, and still have it immediately at your fingertips. Offload your stuff in the text pane on the right, and pick it up again by clicking on the map on the left.
Window structure
The overall structure of the tool, therefore, consists of the two panes. The map pane, in turn, consists of icons like post-its or index cards, and connector lines between them. The text pane, on the opposite side, contains a smaller field for a label, and a larger field for the details. The label of an item appears on both panes.
That’s it. When you click an icon on the left, your eyes will dart at the upper right corner at the detail, because its fixed location allows for such a saccadic motion which is extremely quick and effortless. After a short period of habituation, we seem to ‘gaze’ immediately with our mouse pointer, and so we are eventually able to navigate a whole lot of stuff from a densely packed map.
Dropping and Pasting stuff
To facilitate the offloading, stuff can easily be entered in a variety of ways: by Dropping and Pasting text snippets or files directly into the map pane, by a composition window for simplifying the basic typing, or by a rich Import wizard,
Imports
Currently, the import wizard supports 30 different formats, some of which are imported as ready maps with icon coordinates or just connector lines or tree structures, while others are just taken as split lines from notes, bibliographical data or arbitrary text.
Note that you can also drag most files directly into our windows and paste text into them. Also try to drag text snippets from other applications, or even map snippets from our windows.
Connecting and Condensing
To see the hidden connections of a difficult topic, it helps if the related items are not too far apart. Connecting and condensing are, well, connected activities. Collecting items from different sources is one way to achieve the desired condensing. Another way is picking a short label of a larger paragraph, which is particularly facilitated by our Bold Special function.
As soon as you discovered a new connection, you capture it just by drawing a ‘string’ — freeing your mind for new discoveries.Once you have captured a few connections, you will be able to condense the map even more effectively, by gradually rearranging the map and trying to reduce the length of the connector lines, such that the gestaltprinciples may take effect. And another iteration of the connecting and condensing process can begin.
Diverse relationships
Unlike a concept map, our tool does not urge you to annotate the connector lines. Rather, it allows to express also vague and emerging relationships. Even if you are hesitant to connect two individual items at all, you can still express their conceptual proximity by juxtaposing them into close spatial proximity, or maybe draw a line but color it ‘pale’.And you don’t need to think much about the direction of the link. Although there is a direction visible, it is unobtrusive enough to ignore it.
Rearranging and Structuring
Traditionally, the structuring was thought of as creating a linear, hierarchical outline, by inventing categories and putting all items into these ‘pigeonholes’. After all, the uncomfortable state of juggling them in one’s head only, was usually minimized. But now, with your thoughts offloaded to virtual post-its that stay extremely close to your brain, it is no longer a pain to rearrange them until the true emergent structure becomes visible.
Map handling
To facilitate the most distraction-free rearranging experience possible, the most frequent actions require just clicking and dragging. Many other functions are reachable via right-click or via modified drag. See the ‘cheat-sheet’available via the ‘?’ help menu from the menu bar.
Part 2: User’s Reference
2.1 The File Menu
New
Start a new map via the Composition Window
Open…
Open an existing map, or one or more files whose text or names are to be inserted
Save
Save your file to your hard disk (in the .xml format)
Save As…
Save your file under a different name
Print ?
(In the File Menu.) Displays help for how to print
Quit
Exit the program
2.2 The Edit Menu
Undo
Revert last map change
Redo
Revert last undo
Cut
Cut the content of the rubberband rectangle
Copy
Copy the content of the rubberband rectangle
Paste
Paste contents of the system clipboard
Delete
Delete the content of the rubberband rectangle
Find…
Find a label
Find Again
Find a label again
Select ?
(In the Edit Menu.) Displays help for how to select
Lurid Colors
Color scheme for new icons and lines
2.3 The Insert Menu
Import the Intro Game
Load a little whodunnit
Import the Tutorial
Insert items that contain some help info
Insert Items
Paste, Drop, or Type into a Composition Window
Launch the Import Wizard
2.4 Composition Window
Paste, drop or type input here …
Paste
Press this button to Paste from Clipboard
— Tab-separated text lines are interpreted as label + detail;
— short lines are used as labels;
— longer lines will be numbered, instead.
Drop File here
Drag & Drop an Existing File here
Show Advanced Options
Supports close reading, by offering the following options:
Split by double line-break
Create paragraphs manually; See also: Advanced > Dropping > Parsing dropped HTML
Split by period
Handle single sentences
Continue
Press this button to submit your composed text to the map
Cancel
Press to abort the composition window
2.5 Import Wizard
Select one of the file formats below. Some imports offer more option dialogs; some are described in the blog, http://condensr.de/category/import/ or shown in videos linked from there.
Evernote
If you have an “ENEX” export file exported from the Evernote note taking application
iMapping
A map from the iMapping.info think tool application
DWZ
If you have a “KGIF” Knowledge Graph Interchange Format file exported from the
DenkWerkZeug.org think tool application
Cmap
If you have a “CXL” export file exported from the CmapTools concept mapping application
TheBrain
If you have a “Brain XML” file exported from the TheBrain note management application
Word
A Microsoft Word Document (we take the plain text from each paragraph)
Endnote
If you have am “Endnote Tagged Import Format” file exported (we just split it up)
Citavi *)
A Citavi project file (we extract the core knowledge network)
VUE
A map file from the VUE (Visual Understanding Environment application
RIS
If you have an “Research Information System” file exported (we just split it up)
BibTeX
If you have an “BibTeX” file exported (we just split it up)
FreeMind
A map file created by the “FreeMind” mindmap application or imported into it
OPML
An outline file in the “OPML” format. Notes (e.g from Scrivener) are supported.
Zettelkasten
If you have an “ZKX3” file exported from the Luhmann-inspired notes application.
Luhmann
If you have Zettels downloaded from the niklas-luhmann-archiv.de
Metamaps
If you have a CSV file exported from the Metamaps.cc application.
Gedcom
A genealogical Gedcom XML 6.0 file.
FedWiki
Page names and structure from a local Smallest Federated Wiki.
Hypothes.is
If you have a JSON file exported from Hypothes.is, see jonudell.info/h/
Tagged list
If you have a list of items with tags, separated by TAB
Thesaurus tags
If you have files downloaded from Roget’s or Dornseiff’s Thesaurus
TinderBox
A TinderBox file (we import without adornment, just raw text and links)
GraphXML
If you have a map encoded in the XML-Based Graph Description Format
Roam
If you have a JSON file exported from Roamresearch
H5p
If you have an H5P file containing Image Hotspots, Accordion, or Timeline
EdgeList
If you have a TXT file listing the edges in the format: Source Label TAB Target Label
DemoJSON
If you have a JSON file exported from a certain experimental demo
gRSShopper
If you have a JSON file from gRSShopper
Zotero
If you have a Zotero Report file, after extracting notes with the ZotFile plugin
PowerPoint
A PowerPoint presentation (drop several presentations to get an overview)
(Note)
You can also drag most files directly into our windows and paste text into them. Also
try to drag text snippets from other applications, or even map snippets from our windows.
(folder tree)
You can also drop a folder icon on the Condensr canvas, and get a hierarchical view of all of its subordinate folders and their shortcuts to other folders.
2.6 The Export Menu
You may export the map to one of the following formats:
to WordPress WXP format
WordPress Export Format. You can optionally specify categories by icon color.
to CMap CXL file
ConceptMap by cmap.ihmc.us
to Brain XML file
Create a TheBrain PB-XML import file
to VUE map file
Create a VUE map file
to Zettelkasten XML file
Note-taking application according to Luhmann
items to CSV text file
Just Character separated Values
lines to CSV text file
Labels, IDs and relationships to CSV
to iMapping iMap file *)
Think Tool iMapping,info
to DenkWerkZeug KGIF file *)
Think Tool DenkWerkZeug.org
to H5P content folder
Interactive HTML 5 content, type like ImageHotspots
to Metamaps JSON file (test)
(Think Tool Metamaps.cc)
to interactive HTML page
An HTML snapshot for interactive Read-Only mode
to printable HTML page
HTML graphics to zoom out
*) Limitation
Due to their large size, some functions are only available in the extended version which can be downloaded for free from http://x28hd.de/tool/extended/
2.7 The Advanced Menu
Contains every feature that is not necessary for occasional users.
Zoom the text
Larger text
Also via keyboard shortcut Ctrl/Cmd plus +
Reset text size
Also via keyboard shortcut Ctrl/Cmd plus 0
Smaller text
Also via keyboard shortcut Ctrl/Cmd plus –
Zoom the map…
Zoomable view (less-than-ideal solution)
Hyperlinks on
Click to enable hyperlinks but disable editing in the detail pane
Hyperlinks off (Edit Mode)
Click to disable editing in the detail pane but enable hyperlinks
HyperHopping enabled
Local hyperlinks (#…) used for Find in labels
Layouts
Make Tree
Generates a tree layout and structure for exporting
Make Circle
Separates trees and chains from core circle. See a picture and a video here http://condensr.de/2019/05/06/minor-update-more-layout-functions/
Redraw
After moving an icon into a gap
Try something else
Icons with 2 lines are inserted into the core
Next
When done with rearranging the core circle.
DAG Layout
Directed Acyclic Graph, depth last
Check Overlap Need
If the graph is planar, lines need not overlap
Centrality Heatmap
Warmer colors represent higher betweenness centrality
Flip rectangle horizontal
Flip the selected clipping horizontally
Flip rectangle vertical
Flip the selected clipping vertically
Dropping
Cluster Drag&Drop enabled
Enables to copy entire clusters — may be confusing
Appending dropped stuff
Exact drop position is ignored and new stuff is just appended
Parsing dropped HTML
Try to find headings or lists
Dropped files are UTF-8
Disable for old Windows files
Appearance
Items as Index Cards
Rectangles or circles
Icon Shape Automatic
Show items as circles if more lines than items exist
Big Icons
Presentation Mode
Borders
Display arrows pointing to lost areas
Accelerate
Fast but coarse graphics
Menu Bar
Hide menu bar (restore via rightclick on canvas)
Miscellaneous
Puzzle Game
A random map for relaxing or for testing
Tablet Pen Mode
Doubleclick improvement, Alt-Key for Pen and Touch
Preferences
Not yet interesting
Copy to anonymized map …
Saves a copy with all a-z replaced by x
Legacy Save…
Export to legacy zip file format
Experimental Save
Export to experimental JSON format
Power User Mode
Acceleration, Lurid Colors, and Borders
Another Map Window
One more map (to ALT + Drag item clusters)
WXR to SQL
experimental
2.8 The Help Menu
Located under “?” in the menu bar
Help
Shows a short help page (Cheat-Sheet)
About
Shows version number etc
2.9 Cheat-Sheet
Icons:
Click on an icon to view its detail in the right pane;
Drag an icon to move it;
ALT-Drag an icon to connect it with another one;
Right-Click an icon to change its style or delete it;
Lines:
Right-Click a line to change its style or delete it;
To create a line, drag an icon while pressing the ALT key,
or while pressing the Middle Mouse-button (the wheel),
or double-click before dragging.
Drag a connector-line to move all connected items;
Background:
Right-Click the canvas background to
— create a new item,
— save your map,
— or to paste new input;
Drag the canvas background to pan the map;
Details pane (at the right):
— click the “B”/ “I”/ “U” for bold/ italic/ underline,
— click the “B+” Bold Special to add the marked text to
the item’s label above and on the map
2.10 The Background Menu
Save map…
Same as Save in the File Menu
New item
Inserts a new item at the current mouse position
Paste
Same as Paste in the Edit Menu
Advanced
Paste here
Inserts new items starting at the mouse position instead of appending them at the bottom
Help
Same as Help in the Help Menu
2.11 The Icon Menu and the Line Menu
Change color
Pick one of the six rainbow colors
Pale
Turns the color to pale gray
Dark
Restore the default dark gray
Delete
Delete the selected item or line
Human
(Icon only) Face colors to use the icons for humans
Tree layout
(Icon only) Format the subtree starting here
Advanced
Only in the Line Menu
Delete Cluster
Delete an entire cluster of connected items
Cut Cluster
Cut an entire cluster of connected items
Copy Cluster
Copy an entire cluster of connected items
Flip Cluster Horizontal
Mirror a cluster of connected items over its vertical axis
Flip Cluster Vertical
Mirror a cluster of connected items over its horizontal axis
Jump to End
Select the line end outside the viewport or the one at the arrow head
2.12 The Editor Pane
B
Bold
I
Italic
U
Underline
B+
Bold Special: bold and add the marked text to the item’s label above and on the map
Label
Short text that also appears on the map. To see it there, click the map.
Detail
More text about the selected item, always at yout fingertips.
(Rightclick)
For Cut, Copy and Paste, plus “Copy as List”, plus (with errors:) “Create connected item”
Part 3. Frequently Asked Questions
Some questions, know issues, and tips & tricks about map handling — map appearance — lines — items — texts — system — useful info.
3.1 Map handling FAQs
How can I scroll?
Pan the map by clicking on the empty background canvas and drag it-
Is touch supported?
If your finger or pen simulates the mouse, there should be no problem. There is even some support for tablet pen available from the Advanced > Miscellaneous Submenu.
How can I connect or move items over large distances?
Not perfectly. You can move the icons to provisional locations and pan the canvas, alternatingly.
Can I work with a zoomed map?
No, this is not our way to switch between overview and detail. A similar tool that does a great job at zooming is iMapping.info. You may, however, zoom temporarily to pan or get an impression of the layout, via Advanced > Zoom the map.
3.2 Map appearance FAQs
How can I get an Autolayout?
Not perfectly. Use Advanced > Layouts > Make Tree (in the free Extended Version) but it is often strangely distorted — although I think I applied the UCI libraries correctly. If you use Advanced > Layouts > Make Circle, you may get a satisfying layout after some manual polishing. Some data may suggest Advanced > Layouts > DAG Layout.
Sometimes multiple items move when I am trying to move an icon or pan the canvas.
You may have missed the icon or the canvas and clicked on a line within a cluster of connected items, and so you moved the whole cluster. Just move it back by the approximate same distance.
Sometimes the whole map pans when I am trying to move an icon or a cluster.
You may have missed the icon or the cluster and clicked on the canvas background. Just move it back by the approximate same distance.
Suddenly, one of the panes has disappeared. What now?
Locate two tiny arrows at the upper right or left corner. They sit on the divider between the panes and you might have hit one of them. Click the arrow that is pointing inwards to put the divider back in the middle.
Suddenly, all index card icons turned to circles. What happened?
Probably you are using the default setting Icon Shape Automatic and you created a new connection that outnumbers the item count. This signals that your map is now more of a network than of a loose collection or a tree. If this default setting keeps annoying users, please give us feedback and we’ll reconsider it.
Suddenly, the map scrolled down and a mess of duplicate items appears.
You can get rid of the duplicated cluster of connected items by clicking on one of its connector lines, right-click it, choose ‘Advanced’ from the popup menu (below ‘Delete’), and then ‘Delete cluster’. What happened is that your mouse action was probably interpreted as a drag action modified by a preceding double-click — which yields a drag and drop of that cluster. An early indicator for this is when the mouse does not obey your drag action and, instead, the mouse pointer has a plus sign attached. Next time when this happens, keep calm, don’t release the mouse button, and move the strange mouse-pointer to the window’s upper edge or title bar, until it turns into a ‘No parking’ sign. There you may safely release the mouse button. If you don’t need to drag&drop clusters, leave this toggle (Advanced > Dropping) off.
Can I use pictures as icons?
No, not on the map. To show pictures in the detail pane, you could use the IMG tag of HTML before you insert your input.
How can I revert the colors after using Advanced > Layouts > Make Tree?
Toggle back Advanced > Layouts > Centrality Heatmap.
What do the colors after Advanced > Layouts > Make Circle mean?
They should help to manually identify clusters: Lurid colors indicate icons which are connected to only one side. The color warmth (red through purple) indicates whether the icon is connected to close or distant icons. So it’s a good idea to start with the lurid icons and move the red/ orange/ yellow ones slightly out of the circle, and the green/ blue/ purple ones slightly inwards. Gradually, you will notice ‘forces’ of attraction (lines too long) or repellant (items too crowded), such that you can manually simulate what the so-called ‘force-directed’ layout algorithms do automatically. (Please tell me if you know of such an algorithm that satisfyingly preserves the core circle.)
3.3 FAQs about Lines
How can I add/ create/ draw/ paint/ an arrow link/ a relationship/ an association/ a connector/ a string?
See create a line.
How can I indicate the direction of my connectors?
Not perfectly. There are no arrow-heads, just decreasing line width. But this has the advantage that you can almost ignore the direction if you don’t need one.
Can I change the thickness of a line?
No, but you can make it pale.
3.4 FAQs about Items
How can I add/ create/ write a new index card/ note/ virtual postit/ floating topic/ concept/ idea/ thought/ node/ icon?
See create an item.
How can I select one or more items?
It depends if you want to select a “cluster” of connected items (which is easy), or not (which is Advanced use). See Select.
Can I duplicate one or more individual items?
No, you can only copy and paste a cluster of connected items. As a workaround, you may temporarily add an extra item and connect it. Yes, select them with a rubberband rectangle, then copy and paste them via the Edit menu.
Can I change the size of a single icon?
No, but you can make it pale. There is a switch ‘Big icons’ in the ‘Advanced > Appearance’ submenu, but this is for presentation mode and affects all icons.
Can I count my items)
Not perfectly. If you pretend to Export to WordPress WXR, the items are counted by color.
3.5 FAQs about Text
Can I do Search and Replace?
No, the tool is not optimzed for editing text.
How can I activate any hyperlinks contained in the detail texts?
Click while holding the CTRL key. There is also a toggle in the ‘Advanced’ menu that enables hyperlinks. However, it disables editing, so you may need to revert it later.
How can I markup categories or tags?
Not perfectly. The tool does not privilege hierarchical structures. You can add tags or categories as ordinary items, even without a label, and connect your stuff to them.
How can I annotate my links?
Not perfectly. You can currently add details but they do not appear on the map. Export to Cmap or VUE if you need that.
How can I rename an icon?
Go to the ‘Label’ field in the upper right and replace its content.
How can I insert both a label and a detail via a single input row?
Separate them by the TAB character.
Why is editing in the detail field sometimes impossible?
Maybe you have enabled hyperlinks. Disable it via the ‘Advanced’ menu.
Can I increase the font size of the detail pane?
No, this is an unresolved flaw. Yes, CTRL +
Is there a full text search?
No, just search for labels. But it is easy to view a saved map .XML file with a text editor and use CTRL + F there.
Sometimes the line breaks in the detail field do not obey.
This is an unresolved flaw. Try to select another item and then come back. Try pressing the right arrow key. And sometimes, the line breaks work better the second time. As of Sept 2022, this should be resolved. Please tell us if you still encounter problems.
3.6 System FAQs
What are the system requirements?
The application should run on any Windows, Mac, or Linux PC with a Java Runtime (JRE, free from java.com). It is not yet really mobile friendly, in particular because it makes little sense with too small screens, and even on tablets it is cumbersome to work without ALT key and a third mouse control. Disk space is neglectable.
Is there an installation process available?
No, not yet. There is an installation via MSI (Windows) or DMG (Mac) files, but it does not remember the settings from your last session, and there is no filetype for opening by doubleclick. However, a great way to simplify the daily routine is to put a ‘.bat’ file (Windows), shell script (Linux), or an Automator (Mac) on the desktop which opens any map files that are dropped onto its icon. See here for more.
Can I rely on an Autosave option?
No, you need to save your changes at the end. But you do not need to care about individual changes in the detail pane when you leave it.
How can I print my map?
Not perfectly. See Print
Sometimes, the Main Window stays empty for a long time. Why is that?
The first start of this Java application after your computer startup is slow because the Java Runtime seems to do a lot at startup.
Sometimes, the application does not seem to respond. What can I do?
Maybe there is a popup dialog window waiting but somehow it is hidden behind other windows?
3.7 Useful Info FAQs
Can the application remember my preferences?
No, because there is no installation because the program tries to be minimally invasive.
What are the default settings of the various toggle switches?
All of them are on the Advanced menu and its submenus, except Lurid Colors on the Edit Menu (Default is Off). So just start another instance of the tool and check them.
Why is there no View Menu?
Because the two main kinds of viewing are both permanently and simultaneously available.
What about sustainability? What happens to my data?
Look at the saved XML files with a text editor: your texts are easy to extract, and the application works completely offline. You can export into many different formats, even CSV.