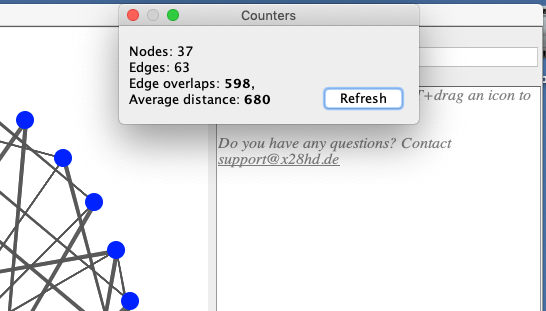
Using a new information window, you can now watch how complex your network map is while you are rearranging it to reduce crossings and distances. Selecting Counters from the info menu “?” in the menu bar, brings up a small unobtrusive window that shows:
- the number of items (“nodes”),
- the number of connector lines (“edges”),
- the number of crossings (overlaps),
- and the average length of the connectors (distance).
A particularly impressive test might be to use random maps. Our little Puzzle Game (available from Advanced > Miscellaneous is now enhanced by
- an option called “More loops” to make the map more complex (and maybe add unavoidable overlaps, see also Advanced > Layouts > Check Overlap Need),
- and a second type of map: “Like planarity” implemented after the famous (now defunct) Flash game by John Tantalo where all overlaps can be eliminated. It comes in two flavors: as circle or shuffled.
Enjoy.
Note that, as usual, this is currently only available in the Java distribution format, not yet in the .MSI or .DMG formats.
One thought on “New function for Complex Networks”